Wednesday, December 7, 2011
Plot Your Graphs Using Google Search Engine
Labels:
Internet
Many of us know that Google is the top most general purpose search engine. But an ordinary user may not be aware that it is capable of doing many more fabulous tasks that are usually hidden and not easily available in the interface. One such thing which I have found recently is that Google can plot graphs of mathematical functions.
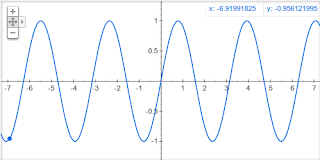
For example if you want to plot the graph of sin(x), just search Google with the term plot sin(x) or graph of sin(x).
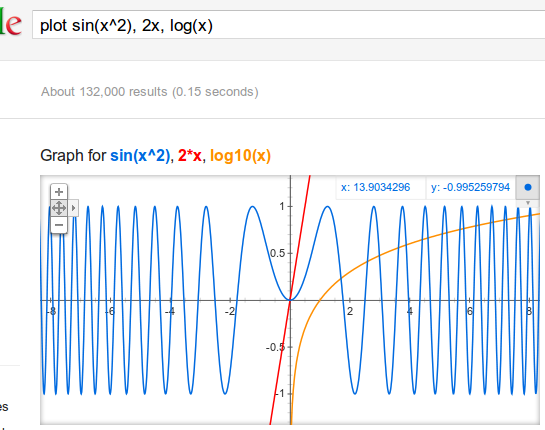
You can also plot multiple graphs and the respective coordinates are indicated at the position where the mouse pointer hovers. You can switch focus to different plots by using button at right top of the graph. Zooming functionality is also available.
The below is the screen shot of plotting multiple functions sin(x^2), 2x and log(x)
Thank you Google for this useful tool.
Subscribe to:
Post Comments (Atom)

http://www.wolframalpha.com/input/?i=sin%28x%5E2%29%2C+2x%2C+log%28x%29
ReplyDeletewolframalpha?
@Alwar
ReplyDeleteThank you. Yes, WolframAlpha is an indispensable computational tool. But when it comes to plotting graphs Google is a step ahead by viewing the coordinates on mouse hover which is not available on WolframAlpha.
After writing this article, I have checked plotting graphs with other search engines. DuckDuckGo (www.duckduckgo.com) is also displaying graphs using WolframAlpha (www.wolframalpha.com).
ReplyDelete